
Tuesday, January 31, 2012

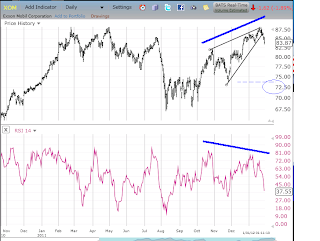
Looks like XOM wants to shit the bed kinda...
Lots of rising wedges building out there XOM, SPG, IBM (ibm did a little fake out but ready to roll over once again) XOM wants 72ish in a hurry, both basis it's RSI minimum target and terminal wedge target....

Friday, January 20, 2012
PUT/CALL relative to it's 10 day average...
Not since the crash 3 years ago has this indicator flashed the utopian all's clear buy buy buy signal.. *sarc!*


Thursday, January 19, 2012
XOM time to trim some of the momo herd..
Don't know what the trigger will be but XOM is about to break out (hourly basis) on shit volume with RSI signaling a big move down there after.. just as it has in the recent past....


Tuesday, January 17, 2012
PUT writers index vs. SPX
The put writers index did well against the SPX since the crash lows but I'm wondering if it might be a contrary signal as it was just before the 08 waterfall


Friday, January 13, 2012
RSI 14 signals vs. SPY
Looking back over the last 12 months there were 5 instances where 14 day RSI eclipsed the 75% line and 100% of the time (5 out of 5 previous signals) the market corrected an average of 11 SPY (100+ /es) points.
We have now touched and rolled under the 75% level for the 6th time...

We have now touched and rolled under the 75% level for the 6th time...

GLD to 120ish ?
If we step back from the micro and look at the macro (technically) and with it only being mid January I don't have any problem with 120ish on GLD, in fact that's exactly what I'm looking for come this spring (April) and still maintain the bull market in pm's over the long term..


I would expect a close on SPY at short term support @ 126ish
I'm calling for a closing price of at least 126-127 SPY and I would also suggest hedging any long pm positions....


Thursday, January 12, 2012
Total put / call ratio vs. SPY levels...
Interesting that the last time the total put/call ratio was this low (coincidentally around these levels right now on SPY) equities drifted higher the next few days (as they have the last few days) before quickly slabbing 200 points off of the /ES....


SPY stalling now about to blow that shorter term rising trend line..
SPY starting to stall out with a bearish RSI sell signal in a larger head and shoulders break out and FAIL pattern...


IBM breaking down..
IBM now breaking down out of a head and shoulders which is part of a larger terminal wedge....


Wednesday, January 11, 2012
I'm looking for a SPY break out failure on the h&s formation..
I'm seeing a complex head and shoulders pattern (left shoulder triangle) in the hour SPY chart which has broken out on no volume and looks to be rolling over signaling FAIL. I expect IBM will lead the charge lower....


Friday, January 6, 2012
IBM hft air pocket via OBV?
Fairly large gap between the OBV levels and stock price relative to the recent past in IBM. Could this be the influence of HFT bid lifting ?


momo herd drooling over the inverse head and shoulders brea out in SPY
The problem is there's no volume and RSI is now flashing a sell. One thing the pattern has done is helped tilt everyone bullish with very few bears left for the HFT/ETF algos to play with...


IBM preparing to test the 180ish
IBM is breaking the rebound lows (lower low) and is perparing to test the 180ish neckline having allready fallen out of it's terminal wedge. I'm looking for low 160's soon.....


Thursday, January 5, 2012
BAC wants 8+ and the weekly RSI is suggesting the bottom is in..
Something is cooking in BAC and it dosn't portend good things for the Bears. The chart is calling for 8+ on the weekly and RSI is saying the bottom is in....


SLV seems to be trading inverse to TLT on the 120min charts lately..
Pretty much ever since the late sept flush in the pm's TLT has been trading inverse to SLV. Looking at the 120 min overlay of TLT/SLV with some crayon action scribbled over it...


IBM tracing out the end of an era..
Looks like IBM is losing it's lower rising wedge line after bouncing back up to it and now rolling over. I can even visualize a head and shoulders affair tracing out inside the larger terminal wedge...


Tuesday, January 3, 2012
I'm looking for SPY to be under 127.00 by 10:30 am est this morning
EDIT: Intraday we've blown through the resistance level but I'm going to stick to my guns and see where we close.
Oh look they're trying to push SPY above resistance @127 to ring in the new year while everyone is sound asleep. Let's see where SPY is at 10:30 est on a closing hour line chart basis which is the time period that connects the dots between 4:00pm on the previous trading day and the 1st hour today...

Oh look they're trying to push SPY above resistance @127 to ring in the new year while everyone is sound asleep. Let's see where SPY is at 10:30 est on a closing hour line chart basis which is the time period that connects the dots between 4:00pm on the previous trading day and the 1st hour today...

Subscribe to:
Posts (Atom)