So far Benny has managed to shake off UGA from it's tracking with the R2K but I fully expect some of his freshly printed fiat to oooze back into UGA until it trades in line with R2K. Il think he plans to smash down gold / gasoline further though first...
Thursday, February 28, 2013
Wednesday, February 27, 2013
13 period weighted moving avg of volume vs SPX
Overlaying a chart of a front weighted 13 period moving avg of volume over the SPX reveals (to my way of seeing it) the choking off of free markets by the fed. The higher they artificially lift prices the longer oxygen is deprived from the free market until it eventually dies off. (volume will continue to collapse) Should the fed release it's grip around the neck of the market in time prices will surely collapse but will eventually survive.
Sunday, February 24, 2013
Friday, February 22, 2013
UGA vs RUT2K
So far it seems this latest contrived take down of the commodity complex has failed based on the idea that the only thing that matters is the price of gasoline at the pump. Given that, looking at the intra day chart of RUT2K/UGA/GLD/JJC it looks to me that UGA (gasoline) is leading the Russel 2k off the lows (circled) and will break out to new highs 1st, unless the contrived take down is not over yet.. which I believe is the case. I'm looking for the lower long term up channel in gold / gld to be tested before the stock market is done correcting lower...
Wednesday, February 20, 2013
another sketch of GLD visualized..
Often markets trade with a sort of symmetry about them and if I sketch in that possible outcome to the weekly GLD chart it suggest a deep capitulating dive below the longer term trend line is very possible and one should not panic (though most will) This kind of move might be necessary to flush the weak hands and would be a fantastic opportunity to pick up physical gold...
Friday, February 15, 2013
GLD 141ish by the end of Feb?
Would be a generational buying opportunity and well within the long term bullish trend... and that's on a closing basis so no telling how deep it could knife down intra-day..
Thursday, February 14, 2013
XOM vs stocks and gasoline
One of the market Generals (XOM) has decided to sit this latest stock ramp out (Russel 2k) while the price of gasoline is surging...
Wednesday, February 13, 2013
and while participation is dying (volume) ever since..
since the 3rd quarter of 2013 the market generals IBM / AAPL / XOM have NOT led this market higher while the Russel 2000 continues on blissfully (highlighted in yellow)
Tuesday, February 12, 2013
In the zone of the Feb. 07 XLF weekly top anniversary..
and crossing right at the 38.2 retrace counter trend target level within the SPX .666 bull leg stall time frame..
Monday, February 11, 2013
I've been expecting a gold flush for a buying oppertunity..
for a long time now (my long term over riding theme) and I'm expecting a sharp flush as our fiat master's try to shake the relationship between printing and commodities. Once the lower channel is tested (may even break below in a 4th wave sort of affair) Then the next bull leg can commence with enough energy to carry well about 2000 an ounce spot...or so I'm thinking
Friday, February 8, 2013
Thursday, February 7, 2013
Wednesday, February 6, 2013
Long FSG (gold/equities) looks juicey for a good pop...
to 24ish as all the fed manipulation (pushing the dollar and vix down and propping up of XLF) will now come off. This will provide a nice run higher in gold or at least outperform while stocks converge lower...or so I'm thinking
Tuesday, February 5, 2013
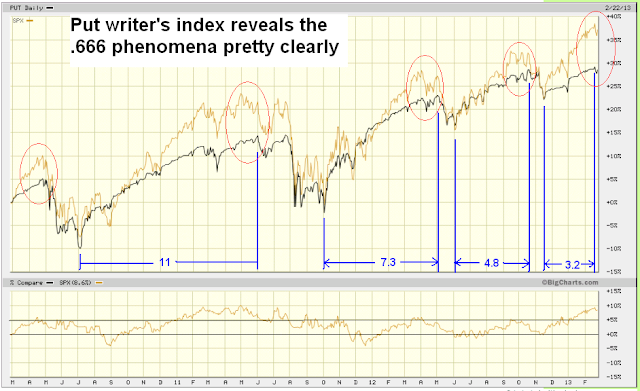
dividing the length of each bull move by .666
While condensing the weekly bars into 7 days per bar I found something interesting. I'm able to divide the total number of bars it takes to reach a top by .666 and count that new number from the lows of where the next leg started to find the next top successively on and on as though like tremors of a major earth quake things are building up to a major event.
Using quarterly T/A on the SPX could this be the topping quarter?
Using basic fib time cycles measured from the post Brenton-woods bottom Dec. 74 low and measuring to the 87 top causes the next fib time period to nail 2000 top. Going out to the next fib target brings us to this current 2013 quarter. Meanwhile 14 day RSI has been diverging bearishly ever since the 2000 fiat pumped blow off top. Interesting wikipedia discription of the 1974 crash if you sub UK for USA and Bank of England with the Fed Resv. Could we see 2013 oil shock ? Will the U.S. officialy devalue the dollar? :
Subscribe to:
Comments (Atom)


