Using the total of all puts/calls on a 20day moving average basis *green line* (wish I could view it as a histogram some way) you'll notice that long steady downward trends in the ratio proceed sharp pullbacks in the stock market with a sort of cyclicality? to it. It appears we are ready for another market take down and just in time for the "as jan. goes so goes the market year"
Friday, December 30, 2011
Wednesday, December 28, 2011
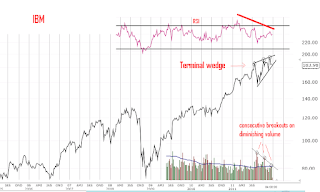
IBM tracing out the end of an era..
I've got IBM tracing out a classic terminal wedge pattern on diminishing volume at each break out to new highs and with the back drop of a glaringly bearish RSI sell signal...
Looking for 99 SPY once 122ish breaks...
Once they finish trying to break the 11/11/11 11:00am highs (line chart) and it rolls back over, I expect support to fail near the 122ish area and then a quick take down to the 99ish area..... this would make sense as the same deflationary spike trade would take GLD down to 120ish...
120 GLD this spring
I've got GLD after breaking up through the longer term rising channel line collapsing back down to support at 120 come this spring and still remain bullish longer term....
Subscribe to:
Comments (Atom)


