
Wednesday, January 30, 2013
using UUPT and XLF to measure gold move in gold
When UUPT catches down to XLF (symmetrically speaking) will mark the target area of the current bullish move in gold (assuming they try to hold the dollar steady right in this range) Suggesting a powerful move higher in gold (which was suppressed but now will push higher to it's nautural price level...

prices are contained bitchezz.. well except for end product fuel prices.
Neat little divergence between UGA (unleaded state side) and BNO (the rest of the world) Is that Exxon shipping fuel over seas maybe ? UGA may need to double again from here to keep Europe from cracking up maybe...


Wednesday, January 16, 2013
Aluminum at near 08 crash lows...
while Ford and GM stock continue to climb on the believe that the economy is improving but with cars and Cokes being about 60% of the price of aluminum why is it not going along for the ride ?

Monday, January 7, 2013
Keeping an eye on IBM..
IBM looks like it's building a flag (which tend to break and follow through in the same direction) Should this be the case and it follows through to it's measured move ending it will have to break the neck line of a larger double top. SPX no doubt will get slapped down as well.


Saturday, January 5, 2013
Another look at the SPX vs VIX-X weekly
The PPT did a wonderful job crushing the last remaining bears but I wonder what happens next ? When I draw vertical lines up from the manipulated VIX-X spike lows I find that they mark SPX turning points.. but how can this be ? Maybe this time will be different.
 and focusing in a little bit.. just wow! Can't wait to see what happens next. lol


Friday, January 4, 2013
Taking a chart of the weekly VIX-X (so that just the down bars are visible for clarity's sake) and overlaying it on a weekly chart of SPX (with just the upstrokes visible) going back to 08 crash lows (around the time when the PPT took over management of all paper assets) it becomes pretty clear that their use of VIX as a pumping tool is wearing out to a point where they get almost nothing at all out of it. Looks like the PPT tried to crush VIX in a last desperate act to push markets higher lol


Long term SPX vs TNX trendline..
Here's a little meaningless (or is it?) freakishnish where we find when ever the TNX touches it's down trend line SPX begins massive longer term bullish moves.. or at least 4 out of the last 4 times. Should this strangeness continue you would expect another massive SPX rally to launch.. that is, after we see another trend line kiss of TNX which hasn't happened yet. What would cause a massive bond rally back to the TNX trend line now.. with apparently the move out of bonds already started and every trader around the world balls deep long with leverage in stocks ?


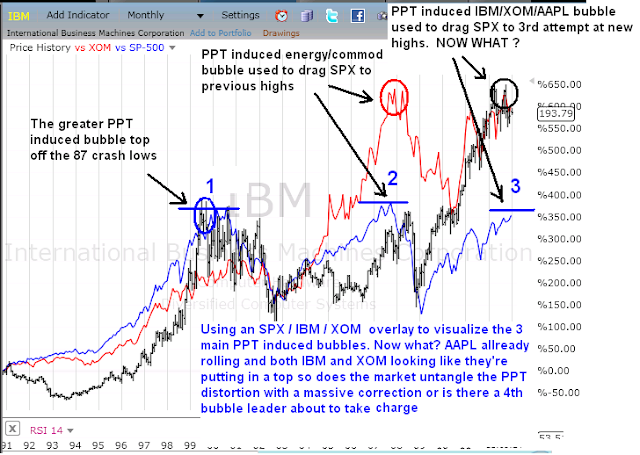
visualizing the 3 ppt induced bubbles
By using IBM (virtual reality) and XOM (hard reality) overlaid on the SPX starting from when PPT's influence on the markets began to dominate pricing, one can see the tools they used to drag SPX higher. 1st techs then hard assets XOM (housing being a hard asset as well) and now both under Bernanke's printing press which brings us to 3 goes at SPX highs. Now what ?
AND LOOKING A LITTLE CLOSER...


AND LOOKING A LITTLE CLOSER...


Thursday, January 3, 2013

Subscribe to:
Comments (Atom)