
Thursday, December 20, 2012
Hard assets vs. fluffy paper..
Interesting divergence between a few hard assets and stock prices... I wonder which reflects conditions more accurately ?

If GLD breaks 150 look for 135 next target...
I ignore the blow off top (which could be thee top) and draw my channel off of the lower trend line which suggests if we blow 150 (triangle support) then expect a hard fast slice down to 135ish before the next long term bull leg begins....


Wednesday, December 19, 2012
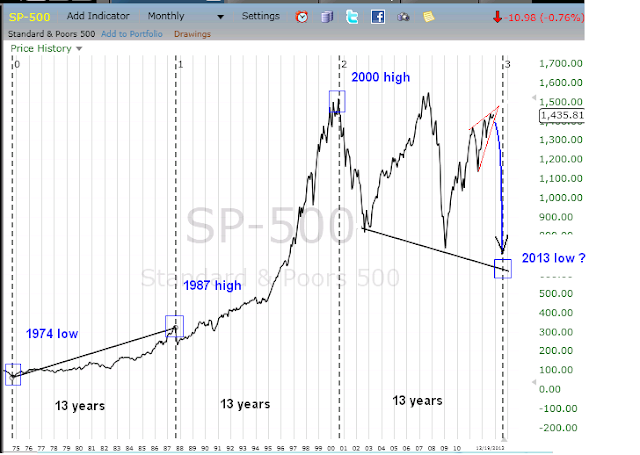
13 year time cycle ?
If you measure from the 1974 SPX low (which would be the lowest price post Nixon's gold detachment) and count the 1987 blow off top pre crash high as the top of the first pure fiat fueled bull leg since Nixon's move (13 years) and measure exactly 13 years more you come to the EXACT fiat pumped high in the year 2000... add another 13 years and all of the increasingly desperate fiat pumpage you find yourself in the fall of 2013. The question is will the fall of 2013 be a high or a low if this anomaly continues ? I suspect it will mark a low....

Interesting technical action in XOM
XOM came back and kissed it's .618 fib level, rolled over and... looks like it stuck it's toe below it's trendline support right at today's close. If it breaks in the morning, I'll be looking for 85ish and would expect XOM to lead the way lower in the stock market...


Dollar supression..
Personally I consider gold a truth detector.. when everyone is corrupt especially those that control money creation, they or their associates and family will trade in and out of gold regardless of what manipulations, schemes or pump operations they are working at any given time. Gold is sniffing out a impending dollar ramp fest and isn't waiting around for the fireworks to start... in my opinion.


As good a place as any to stall out and reverse lower...
/ES so far has retraced to the 75% level of the first leg down off the recent top while at the same time cleaning out all the weak stops. Lets see if she rolls over from right in here....


AAPL's obvious pattern...
So far all AAPL has done in bounce to the area of it's most recent flag or triangle apex and appears to be rolling back into it's down trend.. one could even visualize a measured move target which would be down in the 475ish area and it's lower longer term up channel line...


Monday, December 17, 2012
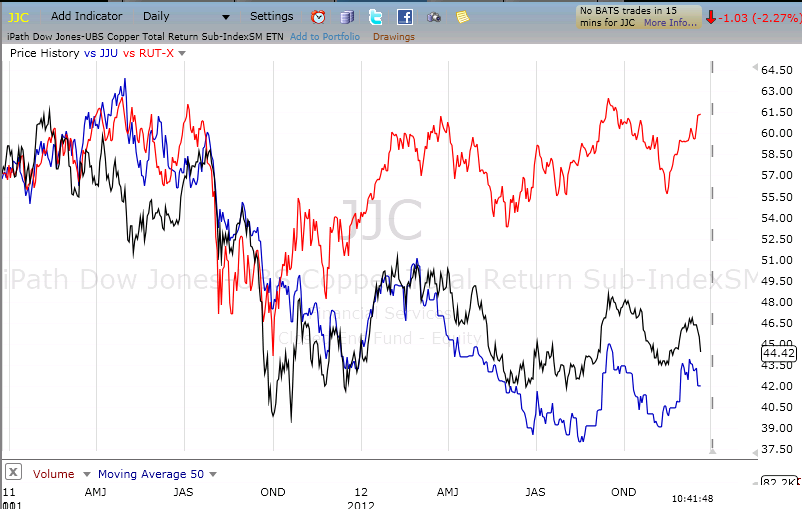
JJC vs UUPT
Is the the relationship between JJC and UUPT on a short term basis revealing an early signal of copper weakness and dollar strength just over the horizon ?


Friday, December 14, 2012
XOM looks shaky from an "Edwards and Mcgee" pov
If this is a breakout failure which volume suggests could be, the market is about to flush for a few months...


Monday, December 10, 2012
RSI on the RUT-x (Russel 2000) looks kinda rich..
What happened shortly afterwards the last couple of times this has occurred ?


Monday, December 3, 2012
SPY wedge or double top (briefly distorted by bernank)
Interesting area of resistance at the SPY 141.50ish area. We did pop it once but only after Bernank promised to bury the dollar via printing. I'm wondering if this is a longer term terminal wedge or a double top the right side having been blown out by the Bernank's infinite printing comments, either or brings me back to a minimum of 1250 and below as a first target and ultimately 1100ish if it's a terminal wedge for a 1st target longer term.


Friday, November 30, 2012

Thursday, November 29, 2012
The only cliff that matters ...
The Bernank is trying desperately to figure out a way to push the Russel 2000 higher without ramping energy prices but as can be seen in the chart BNO (brent) and RUT-x (Russel 2000) are not playing nice. Looks like a flag (flying at half mast) is about to end with a break out higher which will crush the working fool just as taxes are about to get jacked up his ass... time has run out on the fiat games.


Wednesday, November 28, 2012

GLD vs. all else...
If you measure from when all was blissful in the world 05/06 and through all the manic post crisis fed printing. The one asset that appears bubblish is gold when compared to everything else that should have been impacted the same way as a result of the fed desperation, i.e. the CRB (crbq), Russel 2000 (rut-x), copper (jjc), gasoline (uga) If you use debt markets as your fortune teller (despite fed molestations) one would have to assume that gold has gotten ahead of itself...


Tuesday, November 27, 2012
AAPL looking like it wants to stall out at it's .618 fib line measured from it's channel stop..
I prefer to measure from the channel top (not that stop running momo chasing nominal top) when looking for possible limits to counter trend moves. I'm thinking AAPL is ready for that 470ish price area in tandem with SPX 1250ish and gold getting slapped down. Until at least we see obvious signs of the fed printing press kicking in....


Monday, November 26, 2012
Copper not really trying to feel the luv gold seems to be feeling
looking at JJC with GLD in the background.....


Gold which has been front running everything the fed does..
and this 1750 area which is the 2/3's fib line and the top of a corrective flag should be the end of the run higher and I expect will roll over and plunge in a C wave like move which lead stocks lower...


gap in AAPL has closed...
now looking for a retest of the lows... actually think buy stops below the recent low will get flushed...something in the area of 460-470ish..


Friday, November 23, 2012
With the 10 year note out of the picture UGA fills the void
UGA (gasoline by proxy) is taking over the role that long rates use to hold and moves inverse to the feds downside manipulation of interest rates. The lower they push down rates the higher prices to be paid for gasoline as a sort of natural reaction or pressure relief valve on the system. Now with the elections over pressure on the fed to distort energy prices out of the way, UGA can find it's natural price in the mid 70ies... or so I'm thinking.


Wednesday, November 21, 2012
Interesting fib time relationships (marked from the tech top)
Very interesting fib time action going on when measured from the tech bubble top to the 02 bottom and now ending in a terminal wedge that is already broken.. and the cherry is that divergent RSI sell signal


VIX kiss line
There's been a pattern the last 6 times the cboe VIX kissed it's apparent touchstone line which 6 out of 6 times has triggered a sell off in stocks. I believe this latest kiss is marking the beginning of the next decline with a sort of rounding bottom which still allows room to bounce to 1400 to 1420ish on the /ES before the 2nd and nastiest leg of the decline commences.


Tuesday, November 20, 2012
Looks like a1400 to 1425 upside pop on the /ES before new lows..
So far I see no indication that we've bottomed out in a way that builds a sustainable base that the nyfed can commence it's upside skew/molestation. One observation is climax selling volume as the chart below shows there hasn't been any yet though cycle timing wise you might expect one beginning any moment...perhaps a test of 1400 is needed...


Thursday, November 15, 2012
Long term XOM chart
I'm looking for 65ish in XOM over the coming year for the time being via it's RSI divergent sell signal. Also interesting how should that target be hit the much longer term chart picture starts to take on the potential for a double top if 56 gets taken out...


Thursday, November 8, 2012
If the VIX chart were sheet music...
You might expect some crescendo action culminating with a loud "crash" cymbal


Friday, November 2, 2012
In my bones I feel a crash coming very soon. As I stare at the Russel 2000 I can not imagine any other scenario short of a massively bullish break out to new highs (which I don't see happening) so that leaves a sudden and violent discontinuous move price wise. Any normal pull back from here the way the chart has drawn itself just doesn't seem possible visually. That only leaves a sharp crack lower something in the order of what a scribbled on the chart. Nothing scientific here, no system, this is just a result of drawing the weekly chart with various outcomes and posting the one that seems to make the most sense in a time and space kinda way....


Wednesday, October 24, 2012
adjusting 1st downside target to 1250ish
I'm looking for 1325 to fail and price to carry down to 1250 (SPX) while AAPL tests 500ish in the coming weeks...


Tuesday, October 23, 2012
using AAPL technicals to locate the next floor in the SPX
Looking at the weekly chart of AAPL I notice it's RSI reached an astounding 98.90 right at the stocks long term blow off top (I view the second higher high in the stock as stop running those who shorted *the top* which ramped as high as 705ish. Notice the higher high was not confirmed by RSI and in fact now that price is snapping back the other way, it's first resistance to the collapse doesn't come in until 500ish which would satisfy the RSI sell signal while also coming in right at the longer term rising trend line. I'll be using AAPL's price action to help me hold fast to my initial target of 1325ish on the SPX. I'd expect large nasty swings in SPX (SPY) during the fight to hold 500 in AAPL.


Friday, October 12, 2012

Thursday, September 20, 2012

Friday, September 7, 2012

Thursday, August 23, 2012
gold closing line chart basis...
still has not broken out yet and I'm still not convinced it's ready to make that next move up above 2000 YET


Wednesday, August 22, 2012

Gold ceiling just as the dollar is no longer bearish...
Interesting that gold should test the upper extreme ceiling just as the dollar sell signal is coming off and where technicaly both the bond and dollar should bounce higher from here...


US Dollar RSI sell signal....
and in the same way the long bond worked off it's RSI sell signal and is beginning a new leg up so has the dollar worked off it's negative RSI divergent sell signal ( or is very close to it's minimum target) and is read for a new leg higher and with it lower stocks and gold prices... or so I'm thinking.


Monday, August 20, 2012
Based on the current pattern of shadow nyfed equity intervention..
I suspect there is no support for gold until or unless /ES rolls over
and test the lower channel line, which if that should occur look for a
large spike higher on the gold chart as the NYFed comes back in to buy
stocks...or so I'm thinking


Thursday, August 16, 2012
RSI sell divergence on 10 yr treas futs has been relieved
and just as /es is hitting the highs. I suspect we will see a key reversal lower in stocks either this afternoon or tomorrow and mark the high water mark in stocks as treasuries resume their rally once again.


As you might expect, "There's no honor among theives"
I've noticed (maybe because the volumes have been so light) that any time the invisible hand (NYFed??) comes into the market to support stocks someone within the organisation leaks it to someone who then ramps gold up in spike like moves higher. I've overlaid the active /es over the active gold contract on a 30 minute chart and you can see them step in any time there is a risk that the trend line breaks which then triggers near panic buying in gold. or so it seems....


Wednesday, August 15, 2012
Golf clap to the NYFed..
..for orchestrating a more then 20+% decline in the price of gasoline over the coarse of the last 4 months or so. The problem though is that gasoline (as measured by UGA) is about to break out before SPY does but more importantly will it out preform SPY going forward ? Nice work Mr. Fed man


Thursday, August 9, 2012

Inflation shit storm on deck...
The corn chart reveals not only a break out but a flag (half mast) which suggests a massive and powerful move higher while at the same time the dollar keeps inching higher and higher. US is the world's largest exporter of corn to all those weakening currencies. Not to mention gasoline prices getting ready to break out. Maybe this is why gold rather then pressing the top of the range (1900ish) is pressing the bottom. They can't print right now. Speaking of gold, in a completely and totally corrupted system you might expect the fed, banksters, friends and family and even enemies with assist of agents would be front running the next wave of printing (whether Euro banking license, fed QE-3 or China stimulus. Instead nothing, not even the faintest heart beat from gold. I'm looking for a break down in gold not break out, and along with it, sub 1100 /es.... at least at first.


Wednesday, August 8, 2012
UGA / gasoline should tell us soon...
Just how much stealth printing Bernank did to get the /ES above 1400. I would expect a break out and follow through with prices at the pumps at all time highs come election day. This assumes they don't reduce the corn alcohol blend. If they do that then what ? $5.00 gas ?


Friday, August 3, 2012
all the /ES stops have been run out now what bitchezz?
I'm guessing that 1400 doesn't get taken out.. maybe 1397ish teaser but the top is in... or so I'm thinking


Thursday, July 19, 2012
UGA looking fiercly powerful in the chart..
I'm a little confused about QE3 timing. Does the cabal wait to print until new highs in wholesale gasoline, corn, wheat, soybeans etc ? Or will they rush in now before even the zombies realize the connection between printing and prices ?


Thursday, June 21, 2012

Thursday, June 14, 2012
Dialy vs Weekly RSI on SPY


Wednesday, June 13, 2012
JJC vs. GLD
comparing JJC vs GLD and the way their corrective patterns are tracying out, it appears to me that should things break lower GLD will come down hard off a broken spine kind of flush, suddenly and all at once. I've re-shorted GLD via long DGLD in anticipation of just that sort of move..


Subscribe to:
Posts (Atom)