
Monday, June 3, 2013
SILVER bull legs
We've had 2 very recent 500+ % ramps in silver.. The question is can we get a 3rd ? It would project to $110+ per oz.

Wednesday, May 1, 2013
Lunar strangness...
strange that 2 previous long term tops occurred one day after New Moons both on Aug 29 2000 and Oct 11th 2007... all well and good but stranger still is when you project that resistance line across to today you'll find that the coming May 9th New moon appears ready to bisect both time and price pricesly. Very strange indeed... by the way the next day marks the anniversary of the May 10th 1837 stock market collapse and BANK RUNS hmmm... So now I ask myself... is gold front running something ? Why is Benny not going to the Hole? have we seen a Hindenburg recently ? Is aluminum about to break the 08 lows with copper following right behind ? If INDX soldiers like XOM take a hit (and it looks shaky right now) the markets will get trashed. Lots of strange happenings clustering in the coming days and weeks.


Thursday, April 25, 2013
SPY re-approaching long term weekly resistance..
I have SPY re-testing long term resistance which is the line that crosses the highs on the weekly charts over the last 14 years or so. The 1st attempt to break out failed and closed dead on the line. Looks like they want to come in for a second go round... that's fine, I see it holding (on a closing basis) although intra day we can expect a massive key reversal type of affair where we puncture it once again only to collapse back and have the markets turn lower. We shall see we are just about there now...


GLD wants to tuck right back into it's weekly channel..
GLD is taking a direct, quick shot straight back up inside it's long term trading channel where I expect it will tease the bears and cling to the inside of the channel for a few weeks before launching in to new highs...


Tuesday, April 23, 2013
Visualizing BennyB's printing bonanza...
If you start from about the time BennyB when all in full bore print to infinity and take a visual of it's affect in chart form among a few industries it becomes obvious that company's like Alcoa and US Steel, to name just a few, let alone gold miners via GDX need to find a way to get included into BennyB's balance sheet. Perhaps they need to drive their industries into the ground before Benny includes them in his vision of the future?


Friday, April 19, 2013
21 day front weighted mva of NUGT
Pretty massive volume spike in NUGT as it collapsed from roughly 30 to 10. I'm long from 11.90ies


Wednesday, April 17, 2013
another look at XOM against DJIA, Copper and Alumina etf's (JJC, JJU)
With Aluminum approaching the 08 collapse lows and Copper a few steps back it appears that XOM having broke the lower wedge trendline is about to pick up momentum to the down side along with the rest of the energy sector so you have to wonder when the DJIA is going to take notice of everyone else having left the party ?


Tuesday, April 16, 2013
XOM rising wedge vs. SPY (weekly chart)
It looks like XOM may have broken the lower wedge line that has been supporting it and now implies I potential sharp drop to 70ies is possible. In the mean time SPY is adrift in the stratosphere above and ultimately will realign itself with XOM... or so I'm thinking but don't listen to me.. just my own thoughts here.


Monday, April 15, 2013
My downside target on GLD was triggered today
so for now I'm opening positions in NGUT for the short term. My concern is I think /ES is headed for low 1100's in which case gold and associated etf's may very well flat line until the equity slide finishes. The $RUT will probably see the most damage in this down turn so I'm also long TZA as well. Obviously don't listen to me (goes without saying) just my personal thoughts....


Friday, April 12, 2013
SPY is forming an interesting pattern on the charts..
also if you use a line chart (weekly closing price) and extend across the previous 2 tops going back the last 13 years or so it looks like we closed right on the touch point...


I'm thinking 137.50 is doable on GLD
but I'll start loading long *phyz* from 137.75ish should it break down the way I've been expecting it to...


Thursday, April 11, 2013
XOM vs SPY
Technically speaking if XOM is developing into a maturing wedge and should it break down as it appears to be contemplating sitting right on the trigger point and with SPY in the background (red) revealing how far ahead of it's self it has traveled..should XOM break it will be a blood bath in SPY.. big if I know


Thursday, April 4, 2013
Gold is just about ready to start a powerful leg to new highs..
To my way of seeing it gold has one last flush lower that will break support and the longer term channel at the same time. This is where everyone dumps their gold and exactly where I reload long looking for 2800 price target.. or so I'm thinking


Thursday, March 14, 2013
some visual perspective...
Looking back at the performance of the Russel 2000 compared with things like Copper or Aluminum which are used in the real economy for things like engine blocks, tractor trailers, machine tools, electric motors etc etc etc it appears like Benny is succeeding in increasing the paper wealth of his gang of banksta nigga friends while everyone else must suffer the cost. Also find it interesting that the Chinese market (PEK) is basically inline with industrial metals.. so which of these things are hinting at reality I wonder ?


Tuesday, March 12, 2013
Neat trick..
I luv the little fake out move Benny pulled pressing UGA (gasoline) and the pm's lower while lifting stocks in the past week or so.. that was cute, unfortunately UGA will sling shot ahead now and with it mid $4 dollar gas on deck for the spring...or so I'm thinking.. unless he plans to take everything down for a breather...


Thursday, March 7, 2013
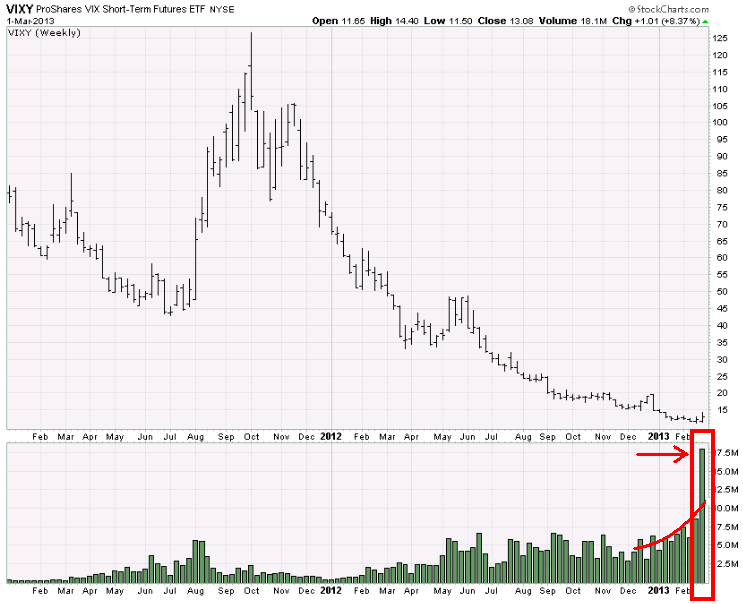
VIXY and moving avg of daily volume
Interesting that VIXY did not confirm the recent breakout in stocks and that volume has been building exponentially as though front running a big shock about to hit from left field..


One of the few areas of the market the PPT has neglected

Tuesday, March 5, 2013
IBM and moving moving avg of volume
IBM is quickly heading towards transaction levels not seen since the mid 1980ies as the banksters continue to prop the market up in the face of folks selling off their paper/IRA's/401k's/pension draw downs etc. I guess at some point soon it will be back to the 1960ies with everyone having left the market except a few computers bouncing stocks back and fourth between each other for the purpose of marking fraudulent price levels.

..and XOM same thing although interesting wedge pattern seems to be maturing right about now...


..and XOM same thing although interesting wedge pattern seems to be maturing right about now...

Friday, March 1, 2013
Another look at Copper (JJC)
It's still possible that copper is trying to find it's natural price (lower) but facing interference from central banksters printing fiat and manipulating economic data which is drawing and extending out the right shoulder of a head and shoulders pattern. In the mean time Russel 2k continues to ignore economic reality...


Thursday, February 28, 2013
UGA (gasoline) vs Russel 2k
So far Benny has managed to shake off UGA from it's tracking with the R2K but I fully expect some of his freshly printed fiat to oooze back into UGA until it trades in line with R2K. Il think he plans to smash down gold / gasoline further though first...


Wednesday, February 27, 2013
Copper via JJC looking like a flag within a longer term triangle..


13 period weighted moving avg of volume vs SPX
Overlaying a chart of a front weighted 13 period moving avg of volume over the SPX reveals (to my way of seeing it) the choking off of free markets by the fed. The higher they artificially lift prices the longer oxygen is deprived from the free market until it eventually dies off. (volume will continue to collapse) Should the fed release it's grip around the neck of the market in time prices will surely collapse but will eventually survive.


Sunday, February 24, 2013

Friday, February 22, 2013
UGA vs RUT2K
So far it seems this latest contrived take down of the commodity complex has failed based on the idea that the only thing that matters is the price of gasoline at the pump. Given that, looking at the intra day chart of RUT2K/UGA/GLD/JJC it looks to me that UGA (gasoline) is leading the Russel 2k off the lows (circled) and will break out to new highs 1st, unless the contrived take down is not over yet.. which I believe is the case. I'm looking for the lower long term up channel in gold / gld to be tested before the stock market is done correcting lower...


Wednesday, February 20, 2013
another sketch of GLD visualized..
Often markets trade with a sort of symmetry about them and if I sketch in that possible outcome to the weekly GLD chart it suggest a deep capitulating dive below the longer term trend line is very possible and one should not panic (though most will) This kind of move might be necessary to flush the weak hands and would be a fantastic opportunity to pick up physical gold...


Friday, February 15, 2013


GLD 141ish by the end of Feb?
Would be a generational buying opportunity and well within the long term bullish trend... and that's on a closing basis so no telling how deep it could knife down intra-day..


Thursday, February 14, 2013
XOM vs stocks and gasoline
One of the market Generals (XOM) has decided to sit this latest stock ramp out (Russel 2k) while the price of gasoline is surging...


Wednesday, February 13, 2013
and while participation is dying (volume) ever since..
since the 3rd quarter of 2013 the market generals IBM / AAPL / XOM have NOT led this market higher while the Russel 2000 continues on blissfully (highlighted in yellow)


SPY (60 minutes) vs it's 21 period moving average of volume..
Wow look at all that side line money pouring into stocks !!


Tuesday, February 12, 2013
In the zone of the Feb. 07 XLF weekly top anniversary..
and crossing right at the 38.2 retrace counter trend target level within the SPX .666 bull leg stall time frame..


Monday, February 11, 2013
I've been expecting a gold flush for a buying oppertunity..
for a long time now (my long term over riding theme) and I'm expecting a sharp flush as our fiat master's try to shake the relationship between printing and commodities. Once the lower channel is tested (may even break below in a 4th wave sort of affair) Then the next bull leg can commence with enough energy to carry well about 2000 an ounce spot...or so I'm thinking


Friday, February 8, 2013

Thursday, February 7, 2013
Wednesday, February 6, 2013
Long FSG (gold/equities) looks juicey for a good pop...
to 24ish as all the fed manipulation (pushing the dollar and vix down and propping up of XLF) will now come off. This will provide a nice run higher in gold or at least outperform while stocks converge lower...or so I'm thinking


Tuesday, February 5, 2013
dividing the length of each bull move by .666
While condensing the weekly bars into 7 days per bar I found something interesting. I'm able to divide the total number of bars it takes to reach a top by .666 and count that new number from the lows of where the next leg started to find the next top successively on and on as though like tremors of a major earth quake things are building up to a major event.


Using quarterly T/A on the SPX could this be the topping quarter?
Using basic fib time cycles measured from the post Brenton-woods bottom Dec. 74 low and measuring to the 87 top causes the next fib time period to nail 2000 top. Going out to the next fib target brings us to this current 2013 quarter. Meanwhile 14 day RSI has been diverging bearishly ever since the 2000 fiat pumped blow off top. Interesting wikipedia discription of the 1974 crash if you sub UK for USA and Bank of England with the Fed Resv. Could we see 2013 oil shock ? Will the U.S. officialy devalue the dollar? :


Wednesday, January 30, 2013
using UUPT and XLF to measure gold move in gold
When UUPT catches down to XLF (symmetrically speaking) will mark the target area of the current bullish move in gold (assuming they try to hold the dollar steady right in this range) Suggesting a powerful move higher in gold (which was suppressed but now will push higher to it's nautural price level...


prices are contained bitchezz.. well except for end product fuel prices.
Neat little divergence between UGA (unleaded state side) and BNO (the rest of the world) Is that Exxon shipping fuel over seas maybe ? UGA may need to double again from here to keep Europe from cracking up maybe...


Wednesday, January 16, 2013
Aluminum at near 08 crash lows...
while Ford and GM stock continue to climb on the believe that the economy is improving but with cars and Cokes being about 60% of the price of aluminum why is it not going along for the ride ?

Monday, January 7, 2013
Keeping an eye on IBM..
IBM looks like it's building a flag (which tend to break and follow through in the same direction) Should this be the case and it follows through to it's measured move ending it will have to break the neck line of a larger double top. SPX no doubt will get slapped down as well.


Saturday, January 5, 2013
Another look at the SPX vs VIX-X weekly
The PPT did a wonderful job crushing the last remaining bears but I wonder what happens next ? When I draw vertical lines up from the manipulated VIX-X spike lows I find that they mark SPX turning points.. but how can this be ? Maybe this time will be different.
 and focusing in a little bit.. just wow! Can't wait to see what happens next. lol


Friday, January 4, 2013
Taking a chart of the weekly VIX-X (so that just the down bars are visible for clarity's sake) and overlaying it on a weekly chart of SPX (with just the upstrokes visible) going back to 08 crash lows (around the time when the PPT took over management of all paper assets) it becomes pretty clear that their use of VIX as a pumping tool is wearing out to a point where they get almost nothing at all out of it. Looks like the PPT tried to crush VIX in a last desperate act to push markets higher lol


Long term SPX vs TNX trendline..
Here's a little meaningless (or is it?) freakishnish where we find when ever the TNX touches it's down trend line SPX begins massive longer term bullish moves.. or at least 4 out of the last 4 times. Should this strangeness continue you would expect another massive SPX rally to launch.. that is, after we see another trend line kiss of TNX which hasn't happened yet. What would cause a massive bond rally back to the TNX trend line now.. with apparently the move out of bonds already started and every trader around the world balls deep long with leverage in stocks ?


Subscribe to:
Comments (Atom)